 Do you have trouble understanding Google Analytics? You’re not alone! I’ve spoken with many small business owners over the years who don’t have a clue how this powerful and FREE tool can help them improve their web traffic and generate more leads and sales for their products/services.
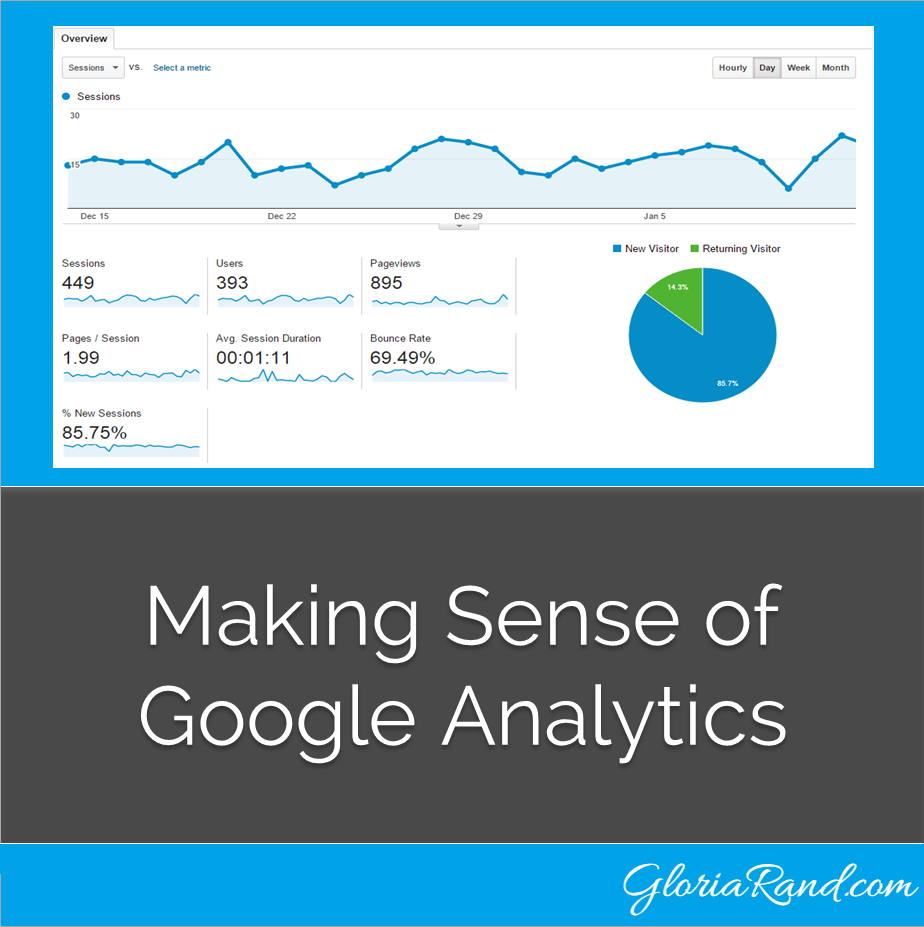
Here are a few key metrics to look for when reviewing Google Analytics.
#1) Bounce Rate – This is the percentage of single page visits to your website. If you have a high bounce rate, that means people are leaving your website after just visiting one page. The goal, then, is to have a low bounce rate, since that means people are staying on your site and viewing more of your content.
#2) Pages Per Session – This number tells you how many pages a website visitor viewed during their session.
#3) Average Session Duration – This number tells you how long someone stayed on your website.
Your goal should be to have people visiting many pages on your site, and spending a lot of time reading your content. The longer someone stays on your website, the better chance you have of converting that web visitor into a lead and ultimately, a customer.
For more insight into understanding Google Analytics, check out the following infographic from OPENForum.com:

Do you have a high bounce rate on your website? Let me help you discover why and how to fix it. Apply for a free 30 minute Internet Marketing Breakthrough Session today.


